Enter Password

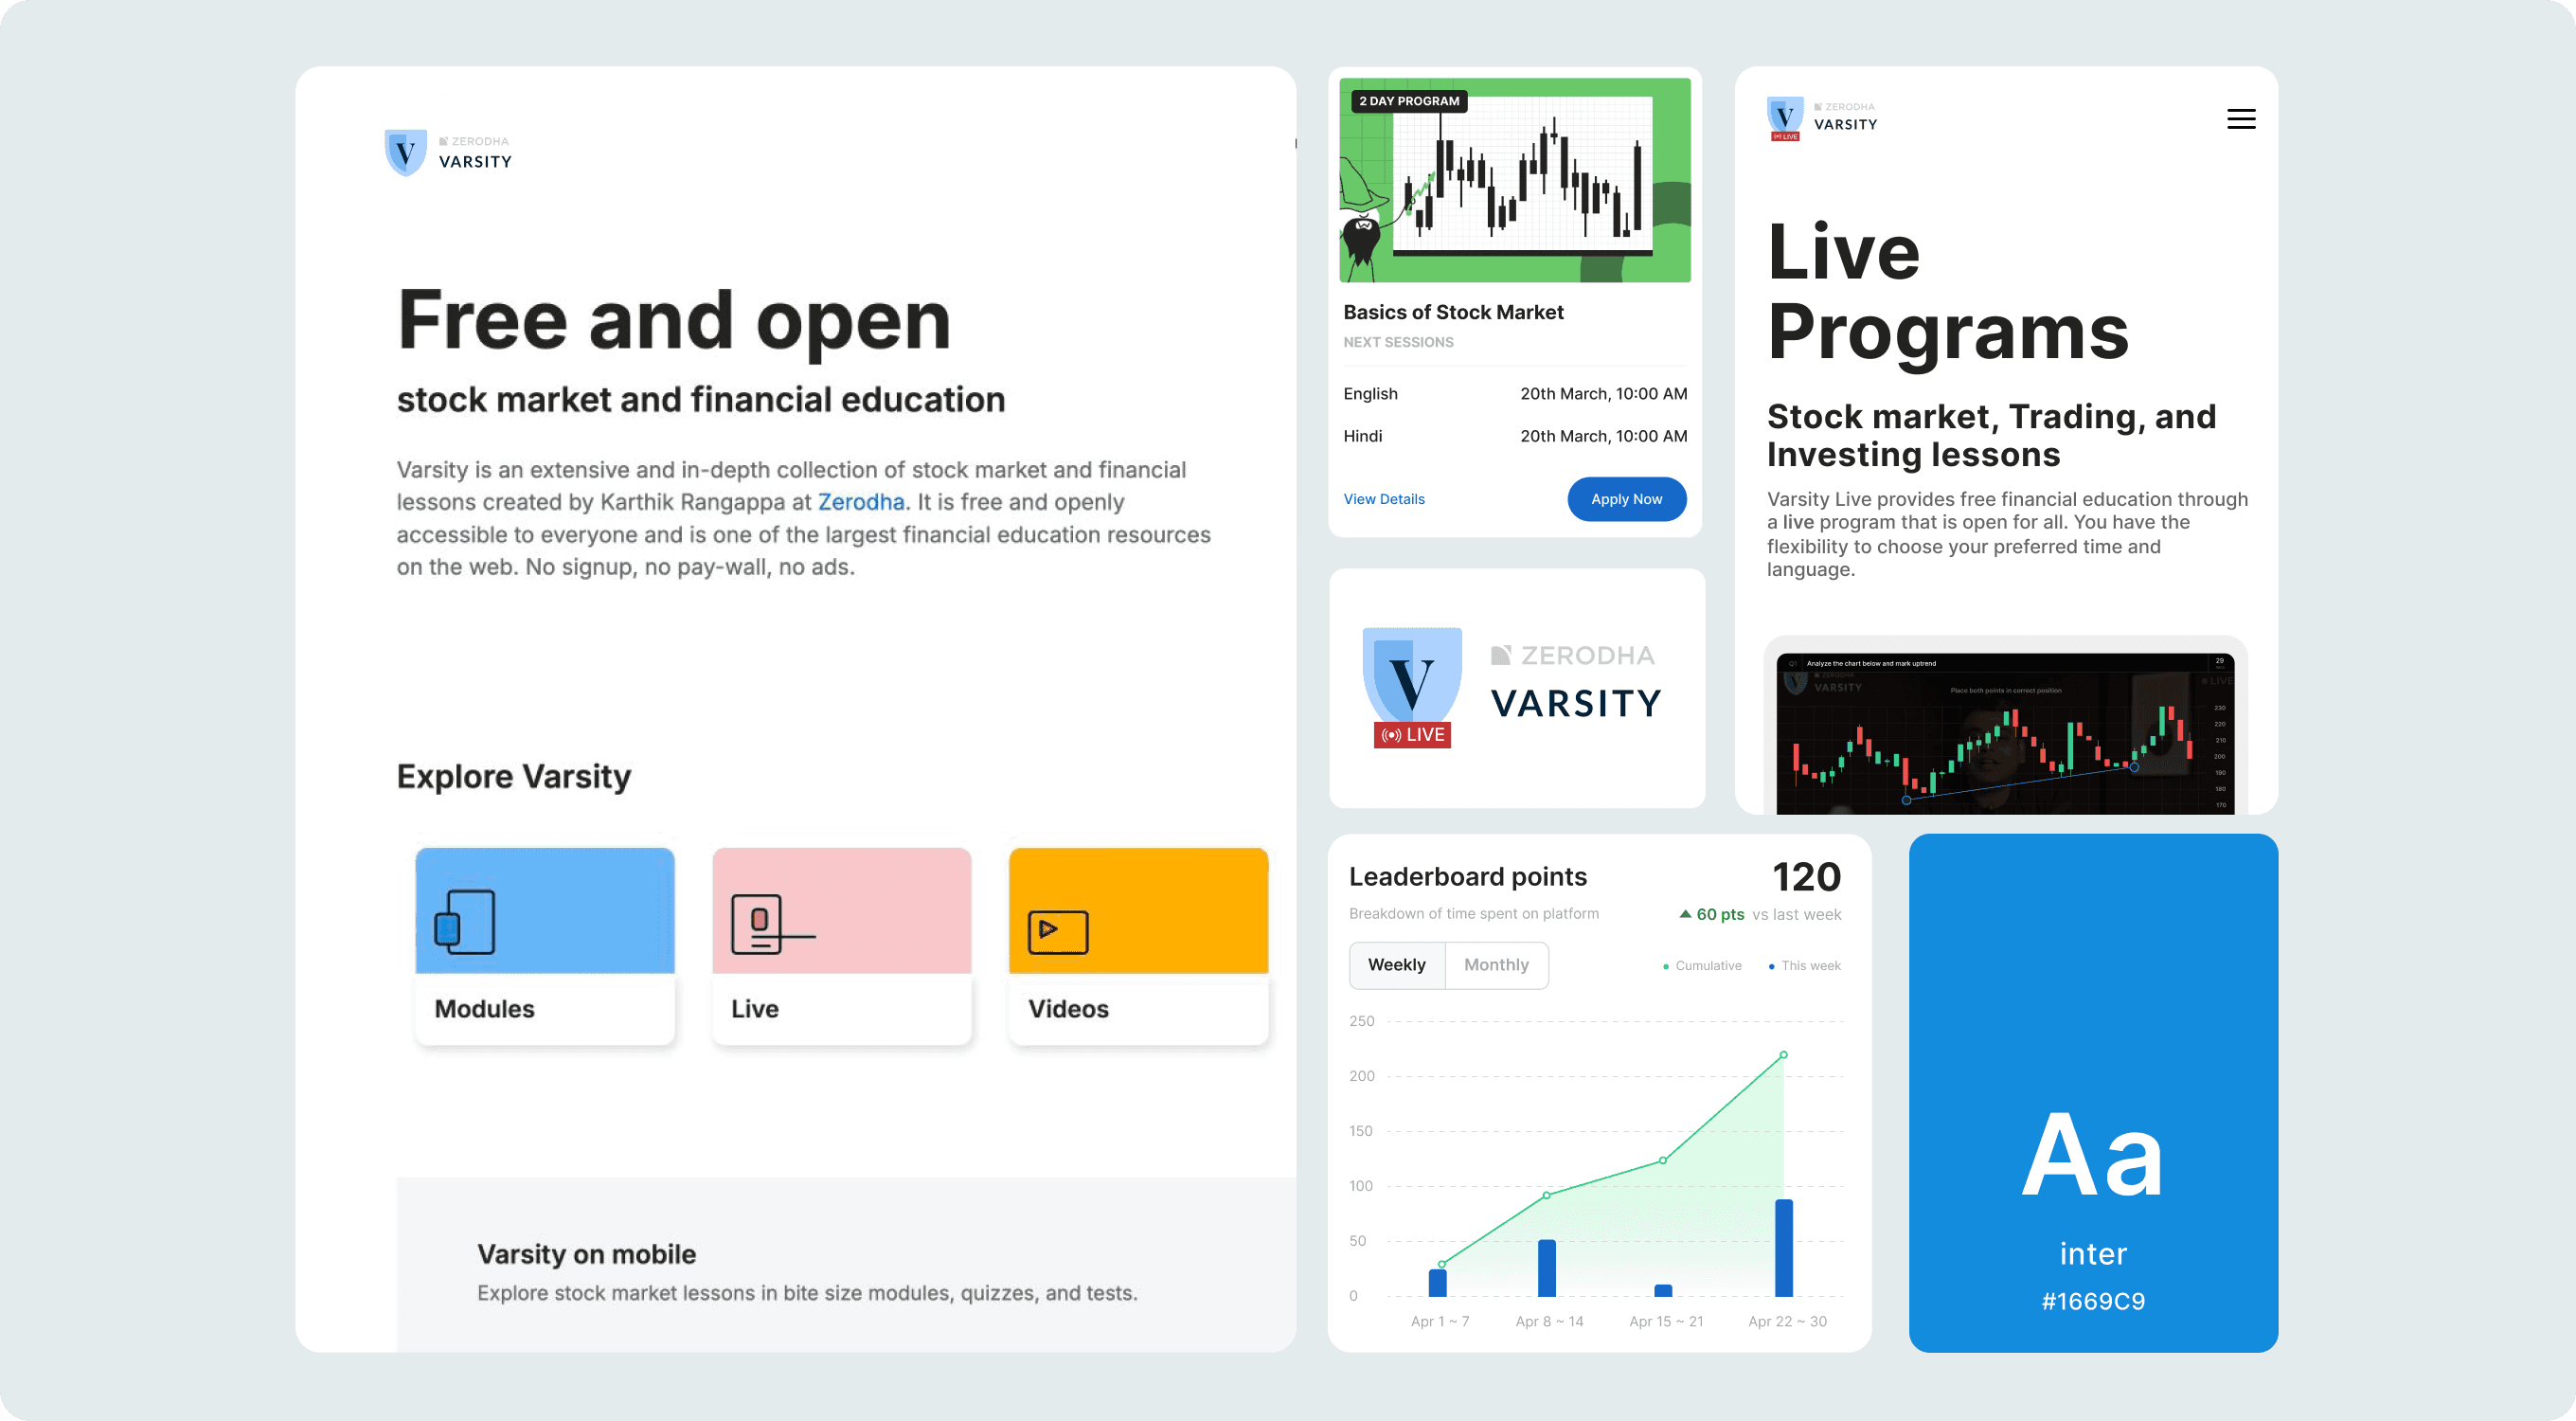
Varsity is an in-depth collection of stock market and financial lessons created by Karthik Rangappa at Zerodha. It is free and openly accessible to everyone and is one of the largest financial education resources on the web. No signup, no pay-wall, no ads.
Varsity Live takes a step further by offering interactive, real-time learning experience
My Role
Product designer - Visual design, User flows, Interaction design, Rapid prototyping
Team & Timeline


April 2024 - October 2024
Stack
Figma, Adobe CC, Lottiefiles, Whimsical, Google docs, Jira, Slack
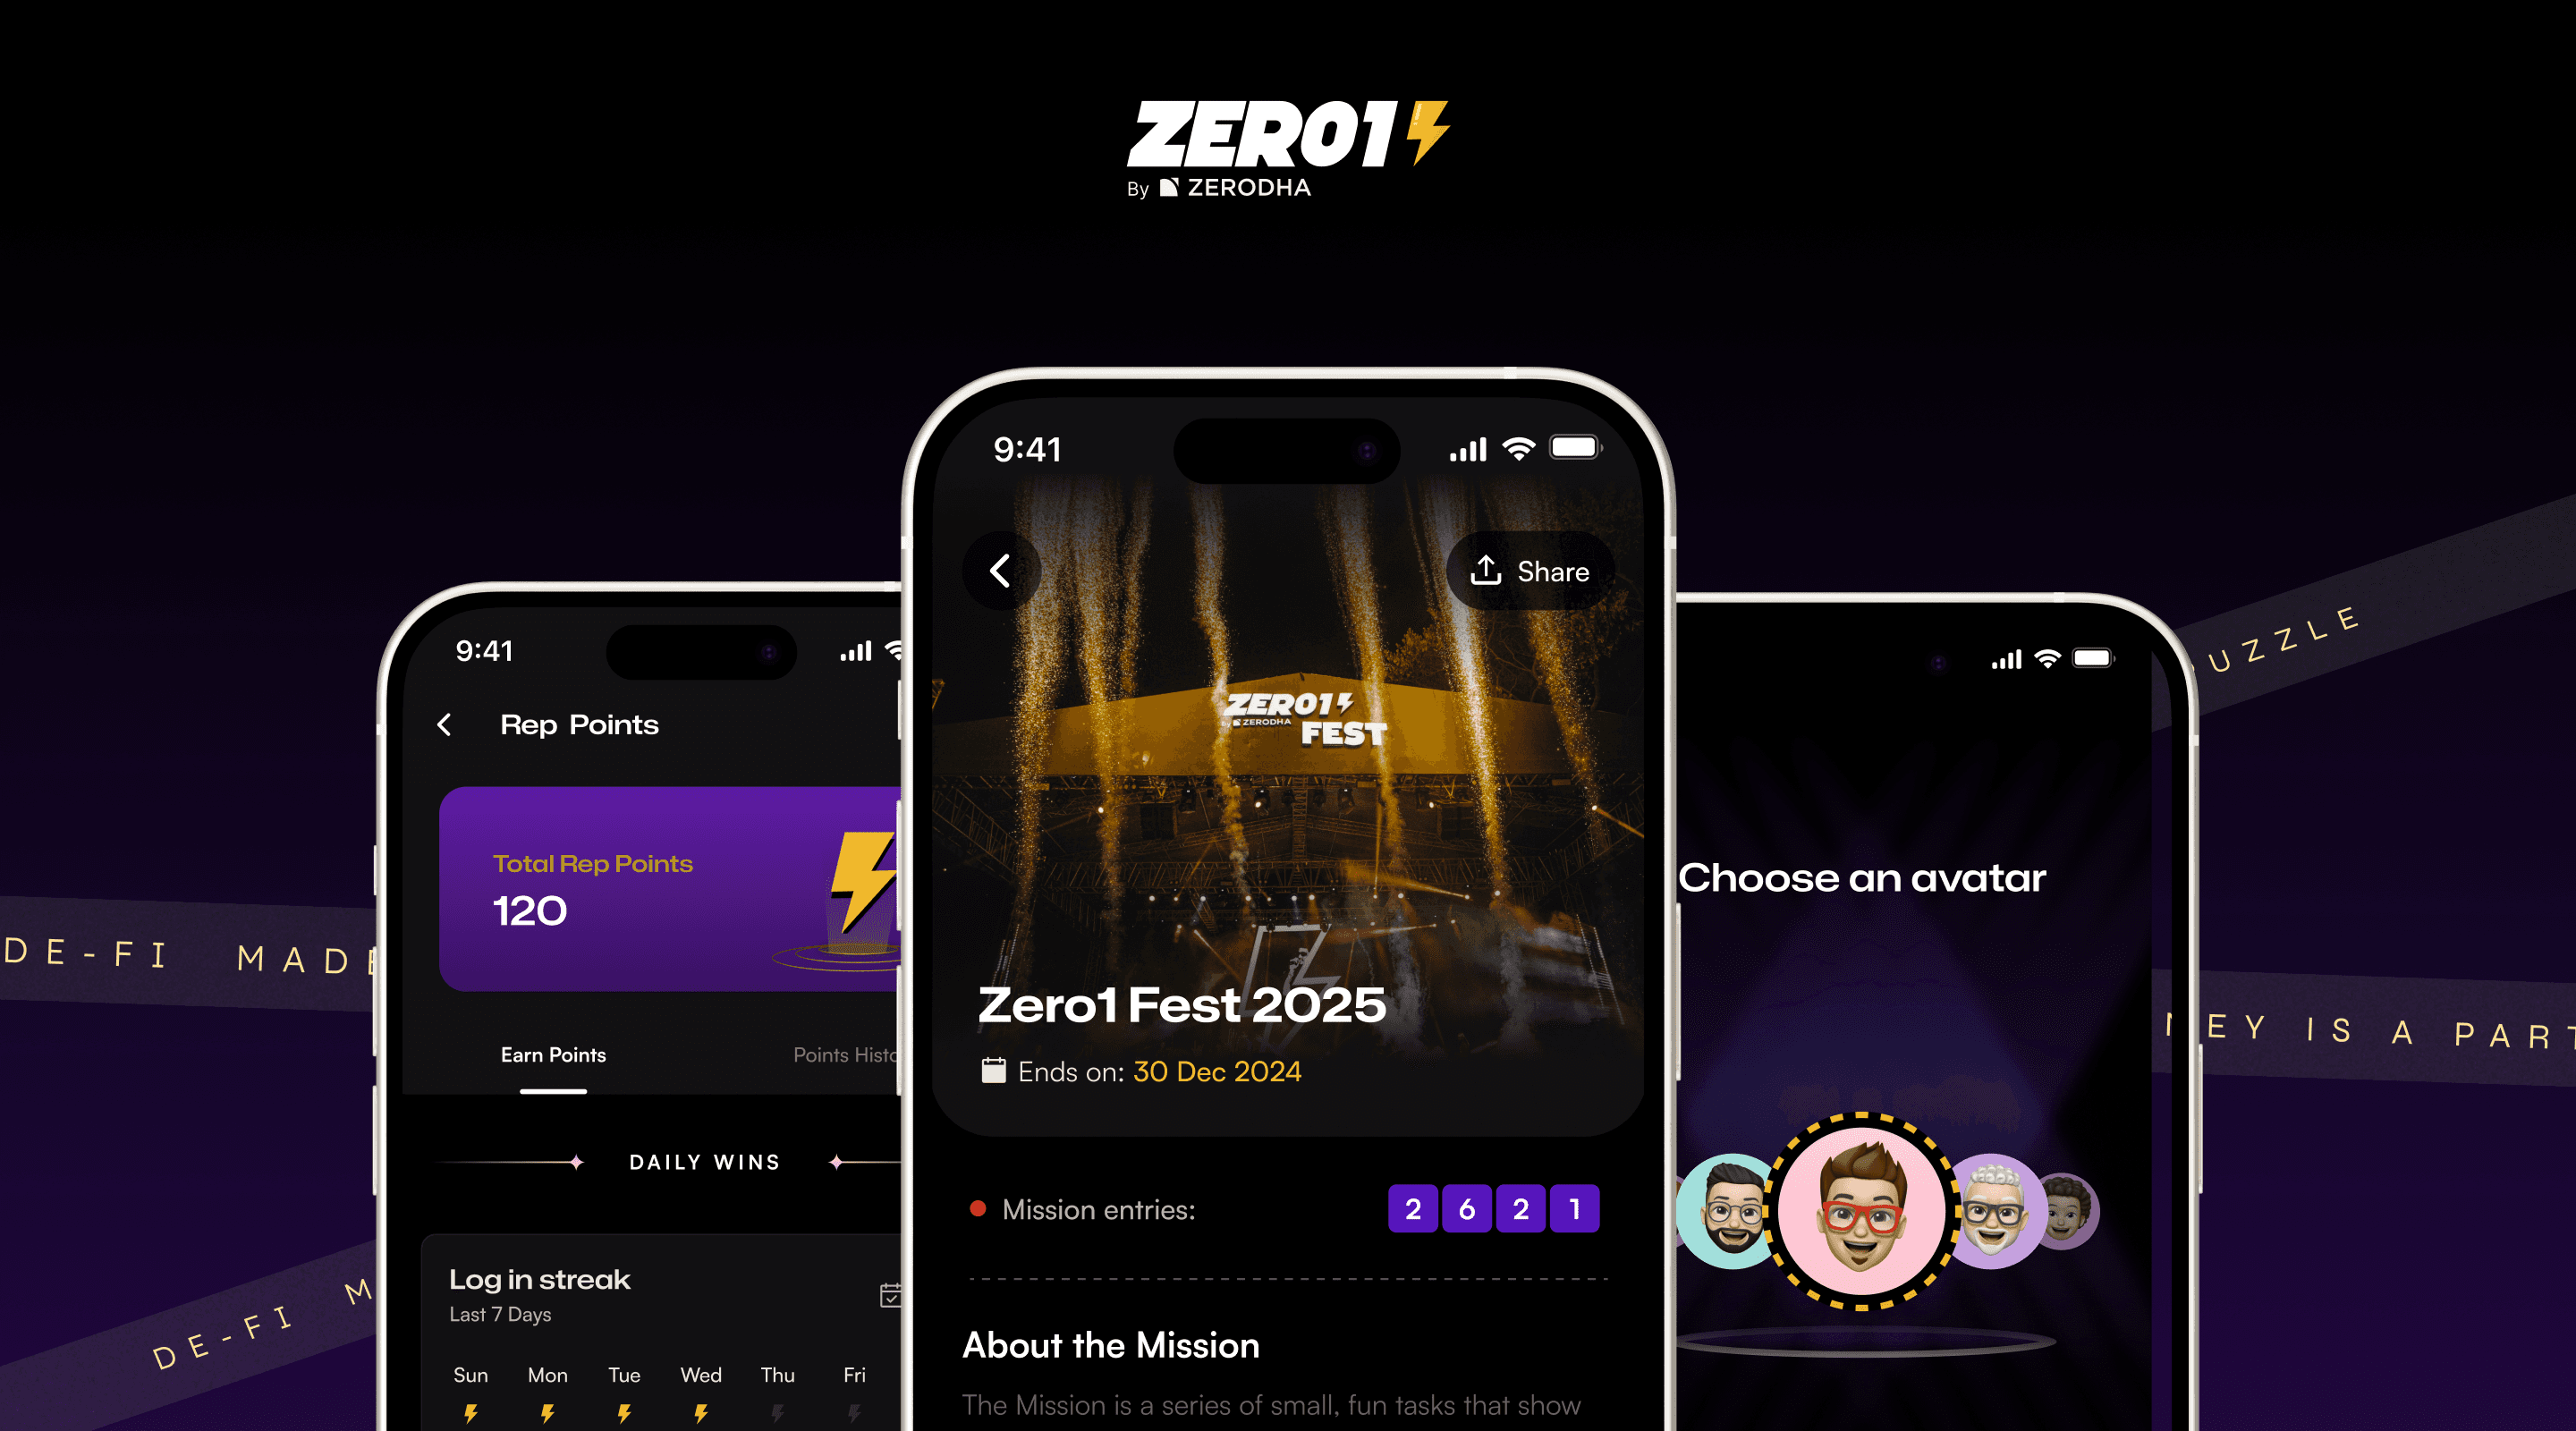
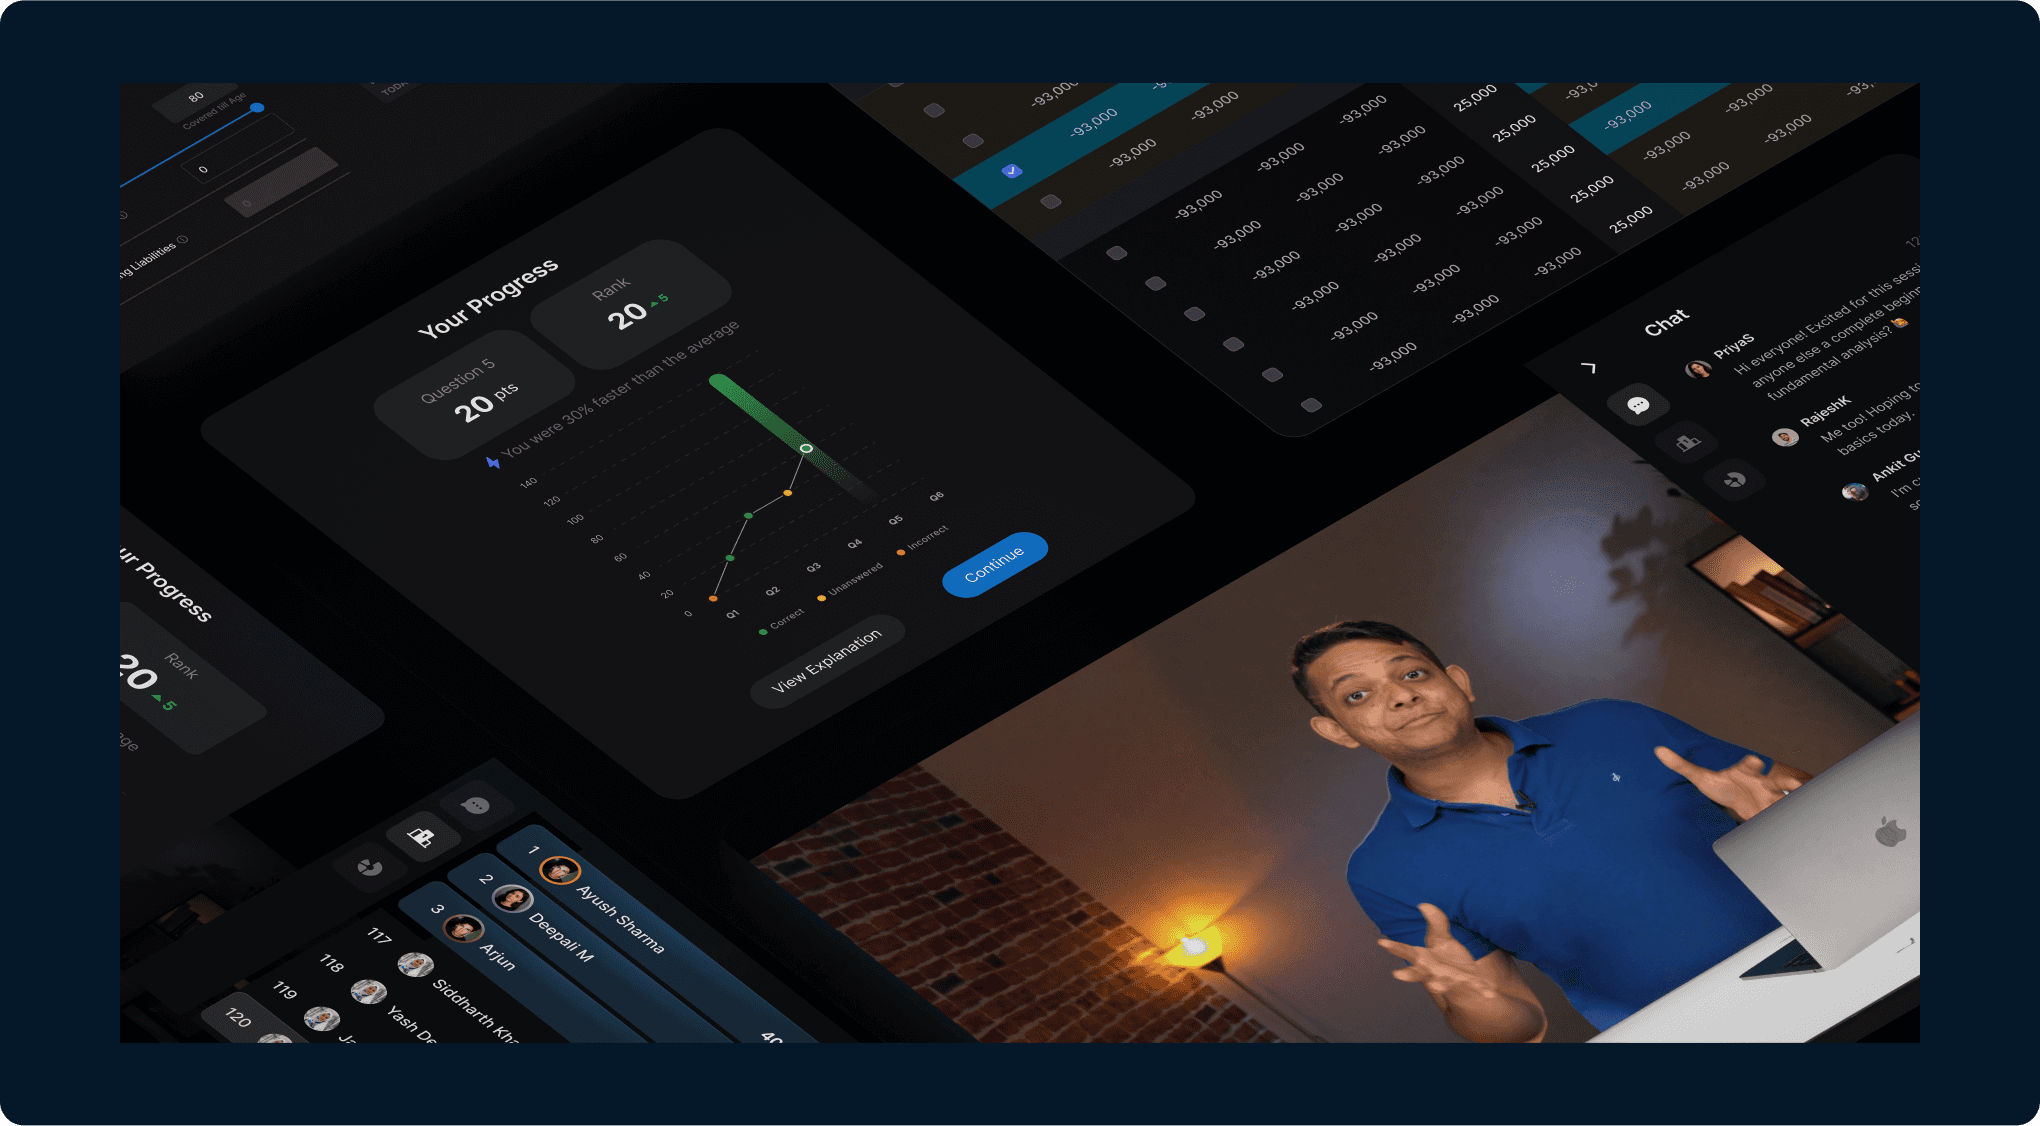
Clean and Distraction-Free Interface experience
Varsity Live provides a clean, distraction-free interface following the Zerodha design language. Avoiding persuasive colours and marketing-driven copy, ensuring a consistent and purely educational experience across the entire platform.

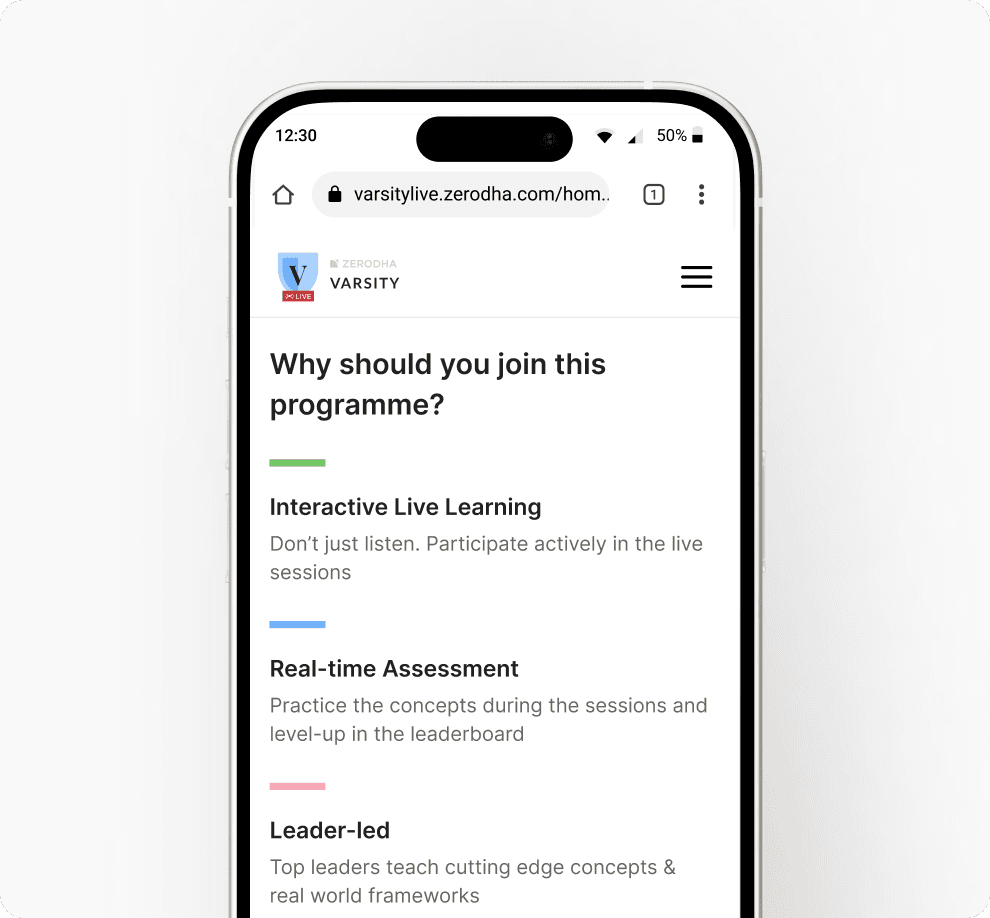
Redesign of Homepage that show Practice Features - Leading to increase 22% in landing to registration ratio
To better communicate the platform's core value homepage features a dynamic video that gives you a direct glimpse into the Varsity Live session (practice-based learning) showing the interactive practice based learning, Live instant mentor feedback and community learning.
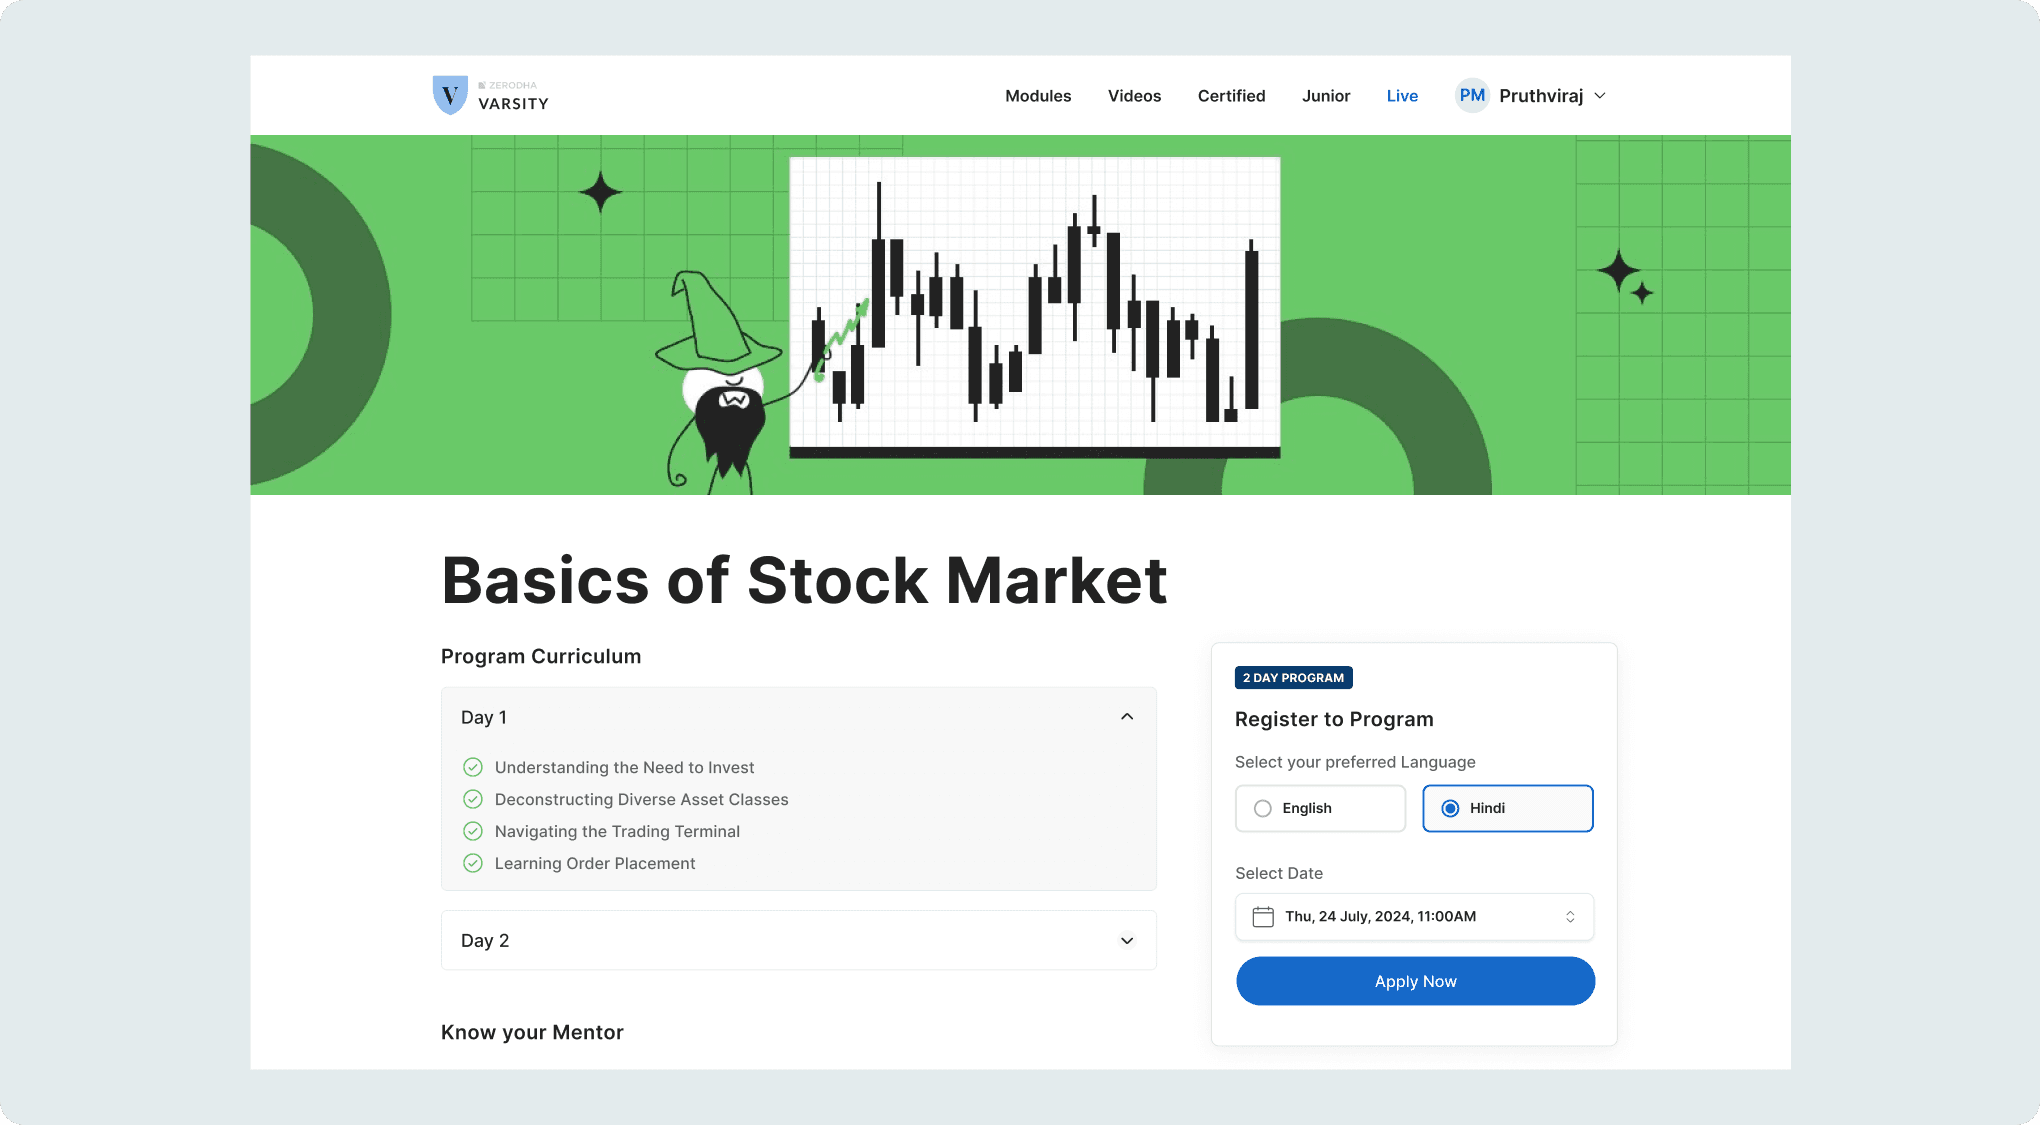
Program details page - Improved UX in program registration flow
Empower users to select their preferred language, date, and time with ease. Replacing the dropdown with radio buttons makes options visible front and center, simplifying cohort registration. Eliminating the pre-selected session bias for many.
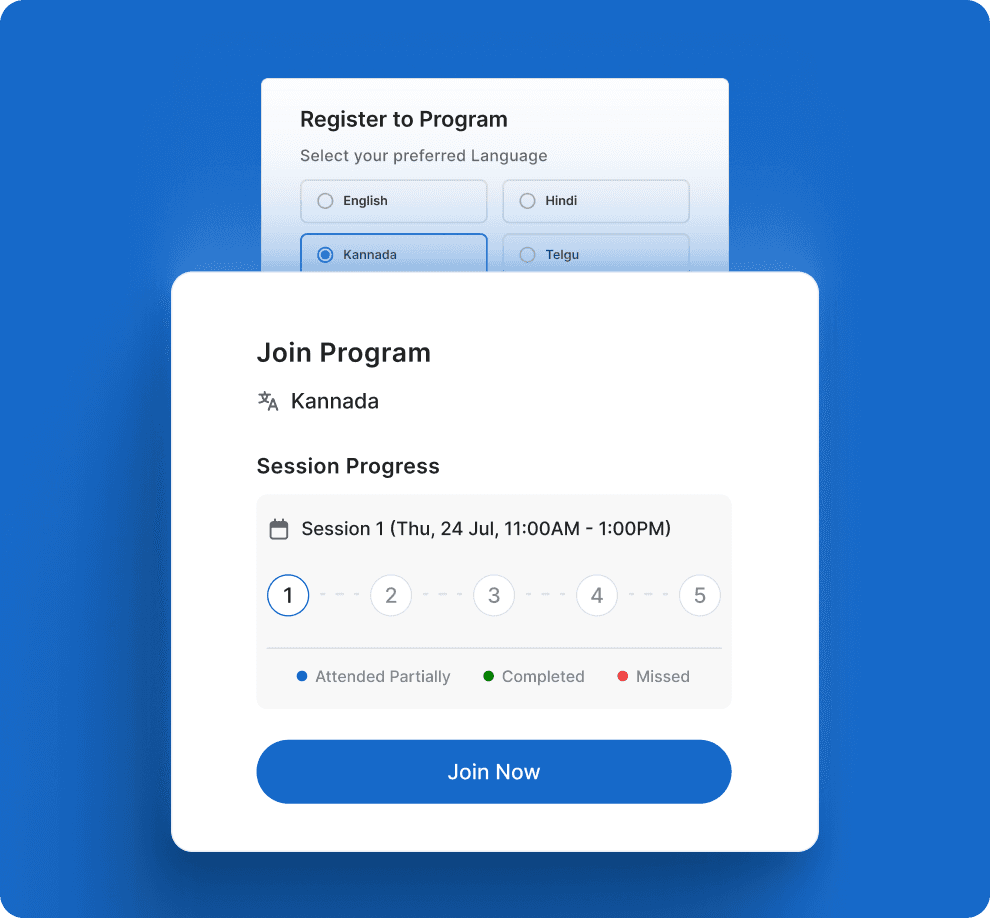
Track user progress seamlessly with a session indicator, monitoring up to 15 sessions per user.
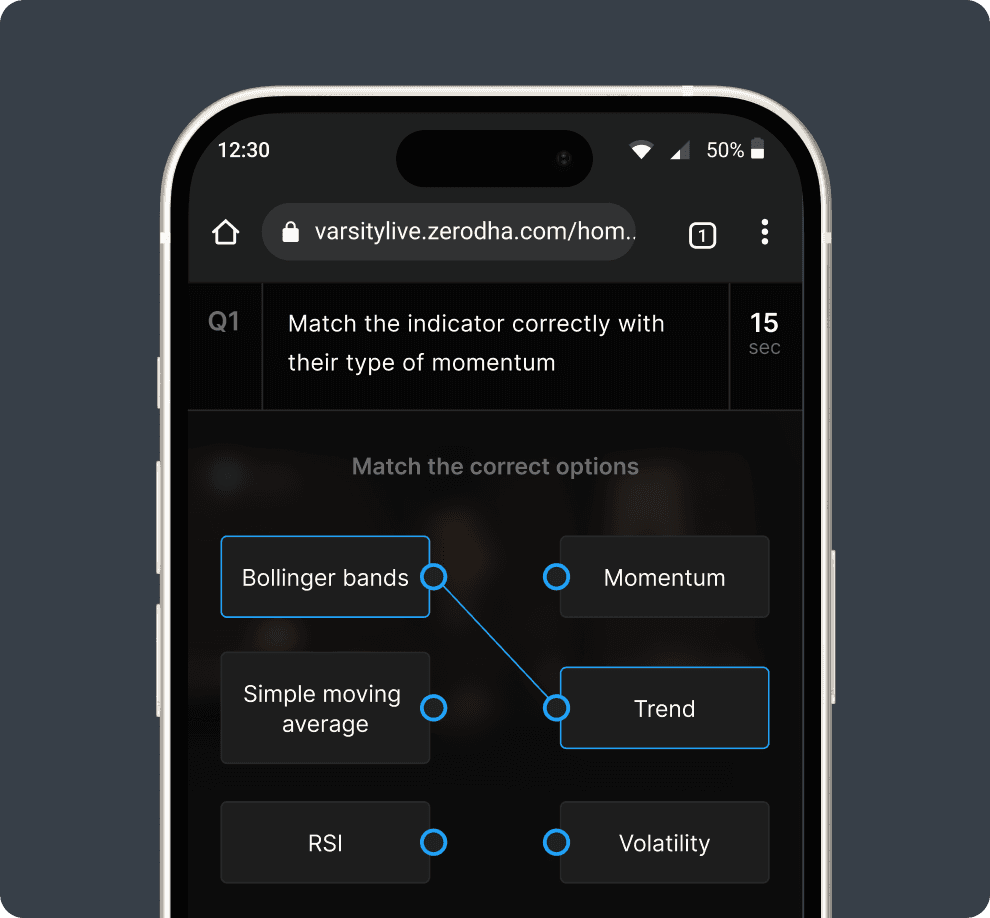
Optimized for mobile first, as over 76% of users access Varsity through their mobile devices.

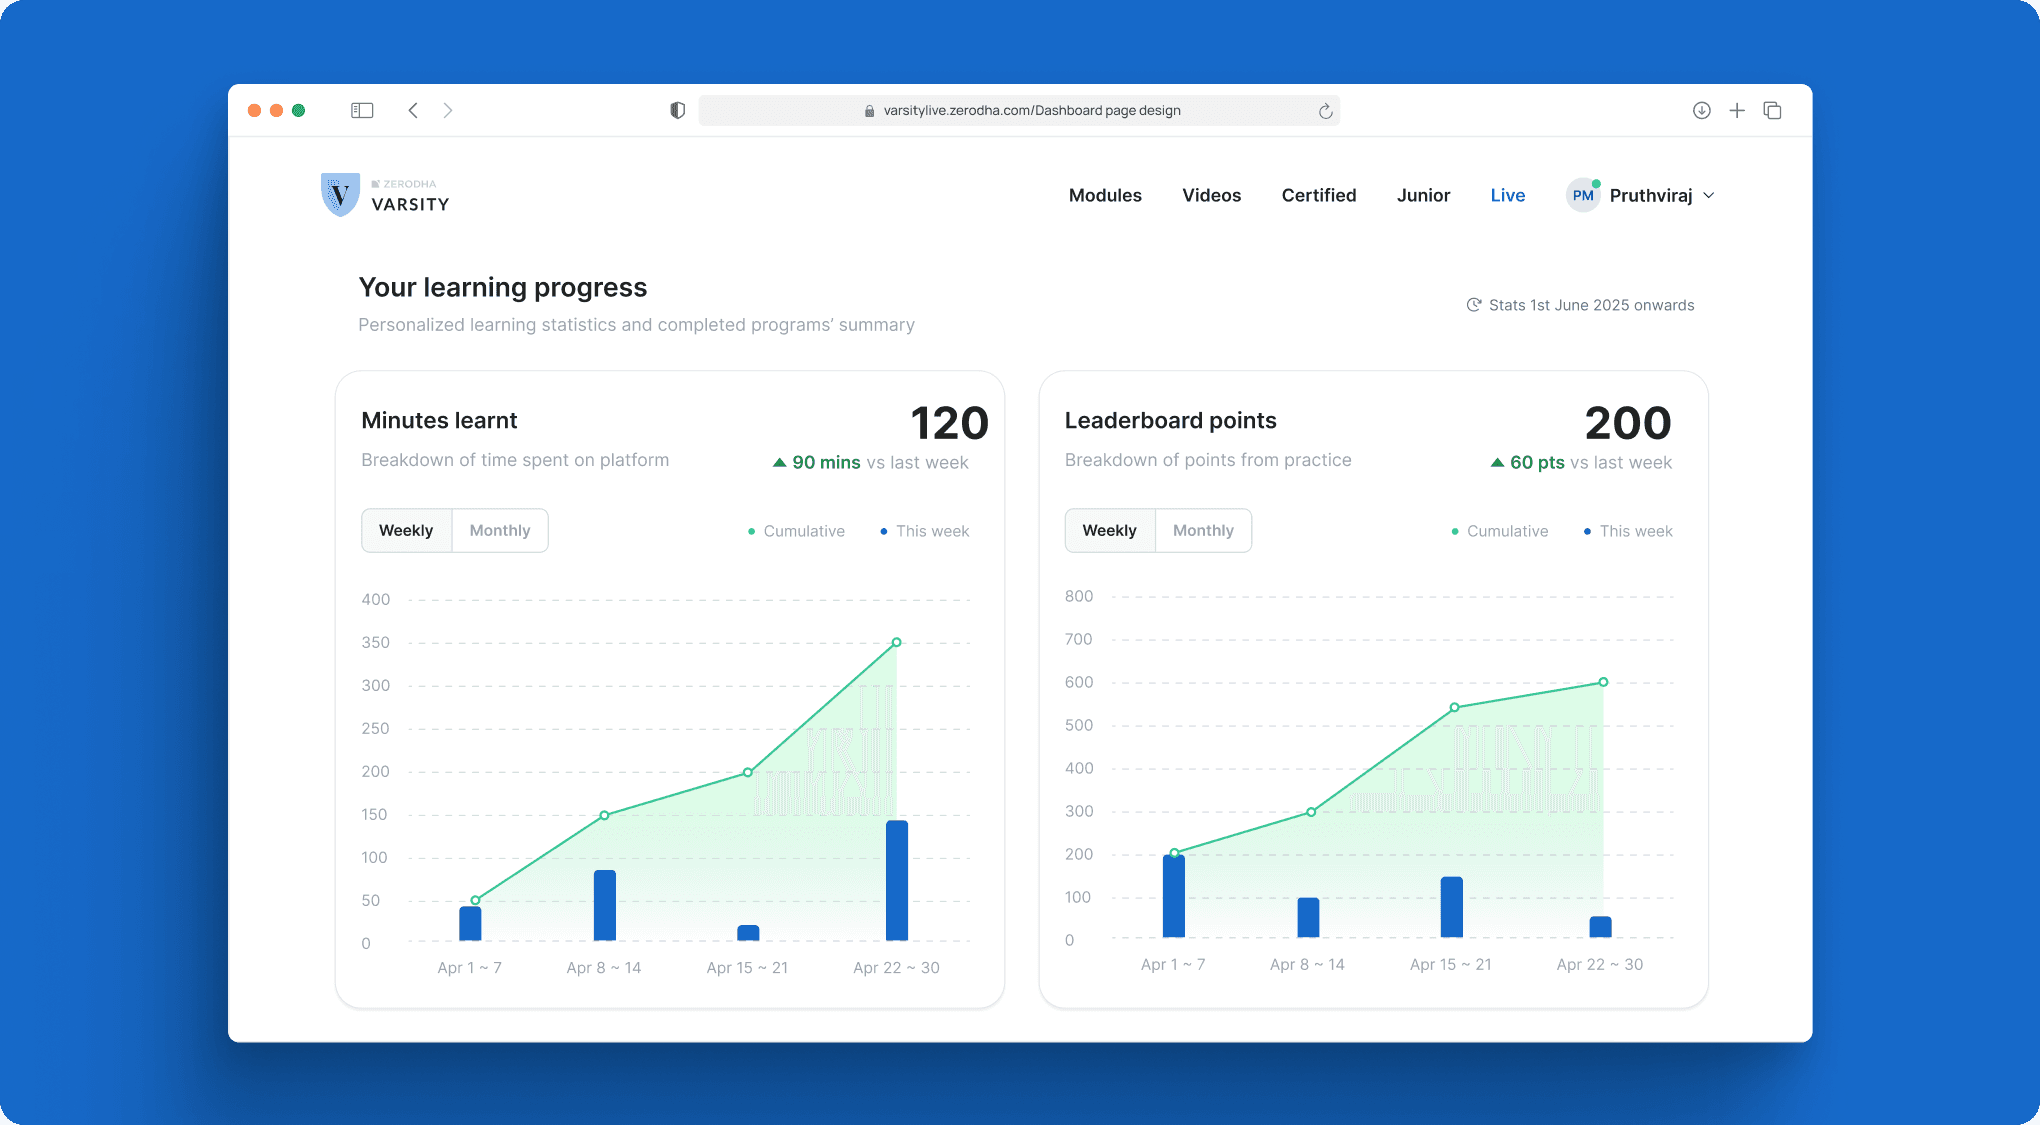
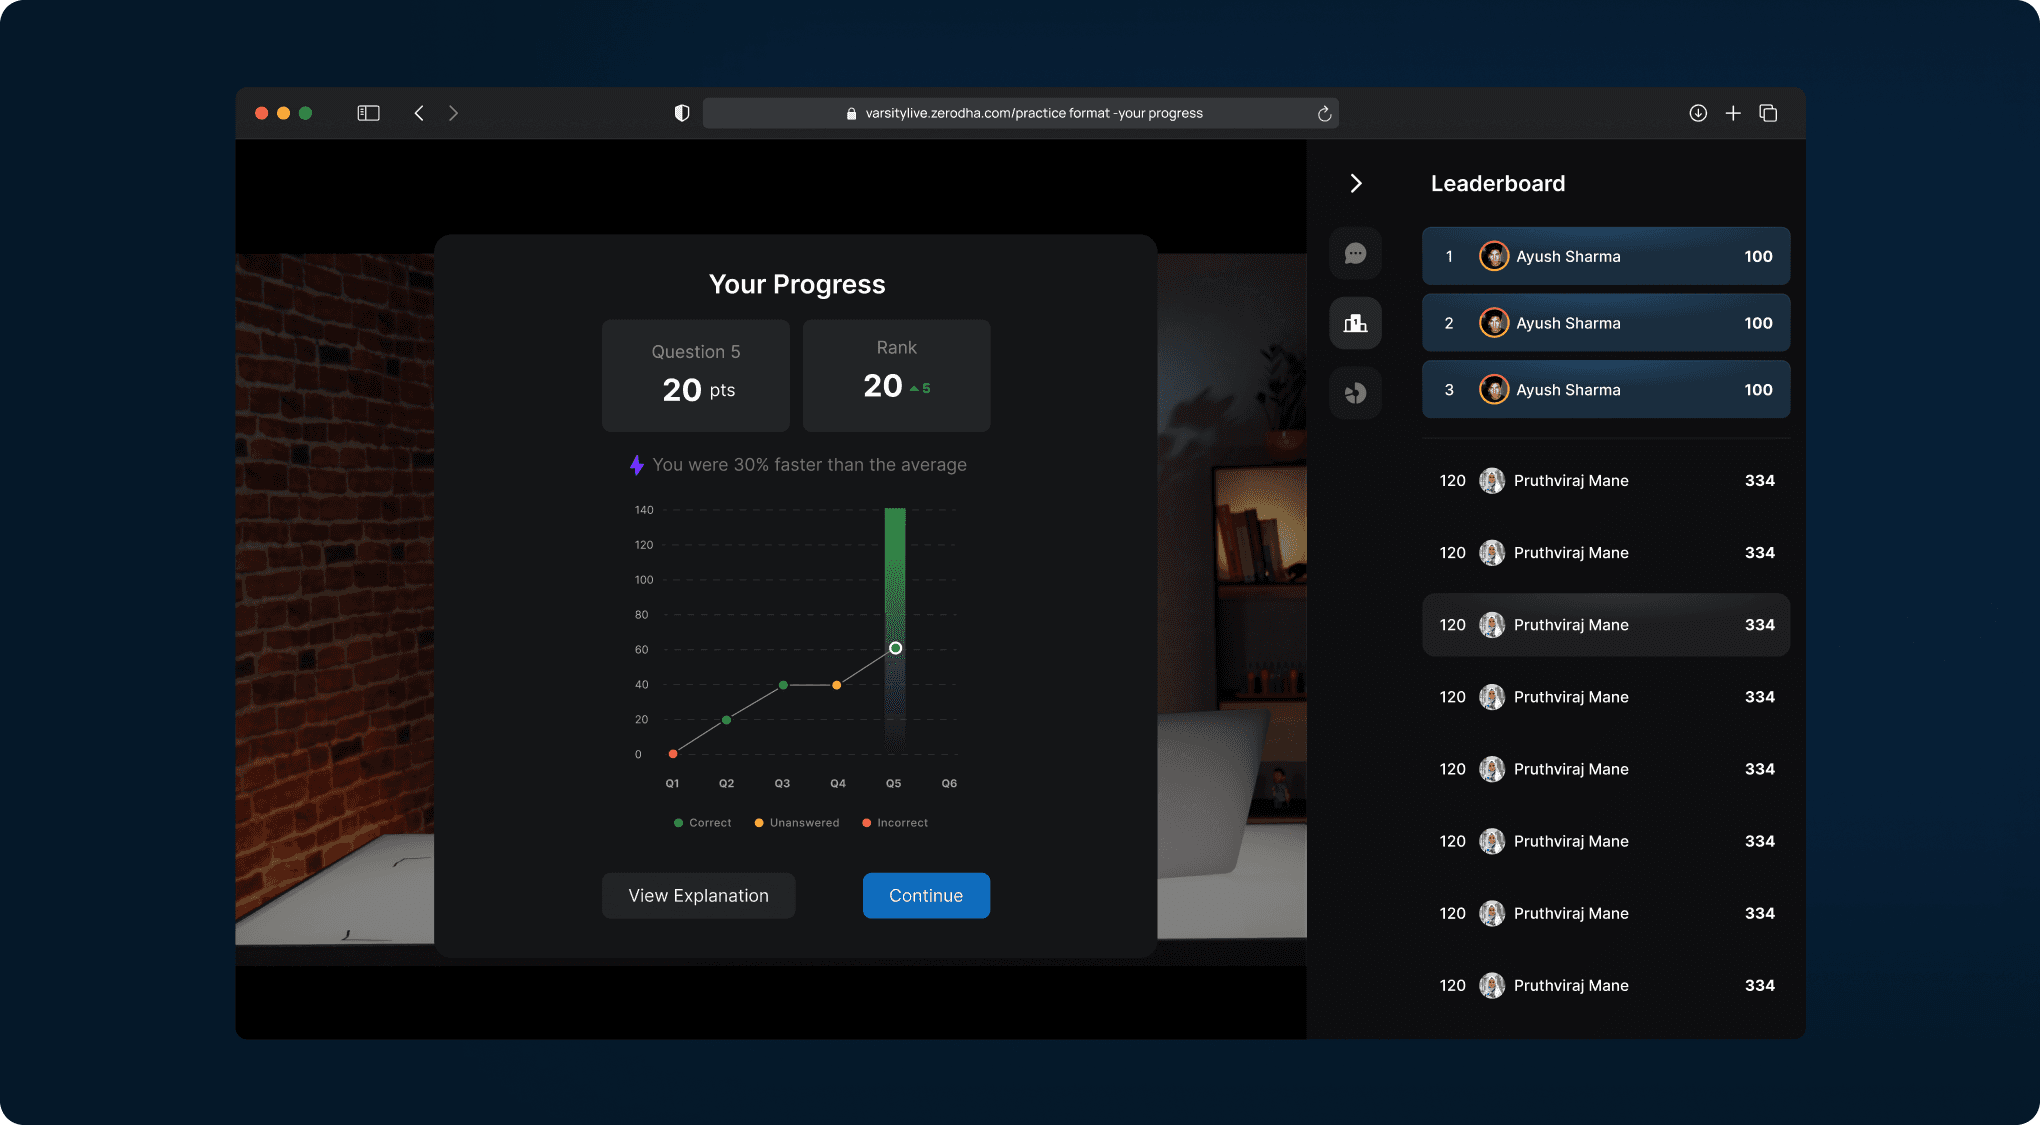
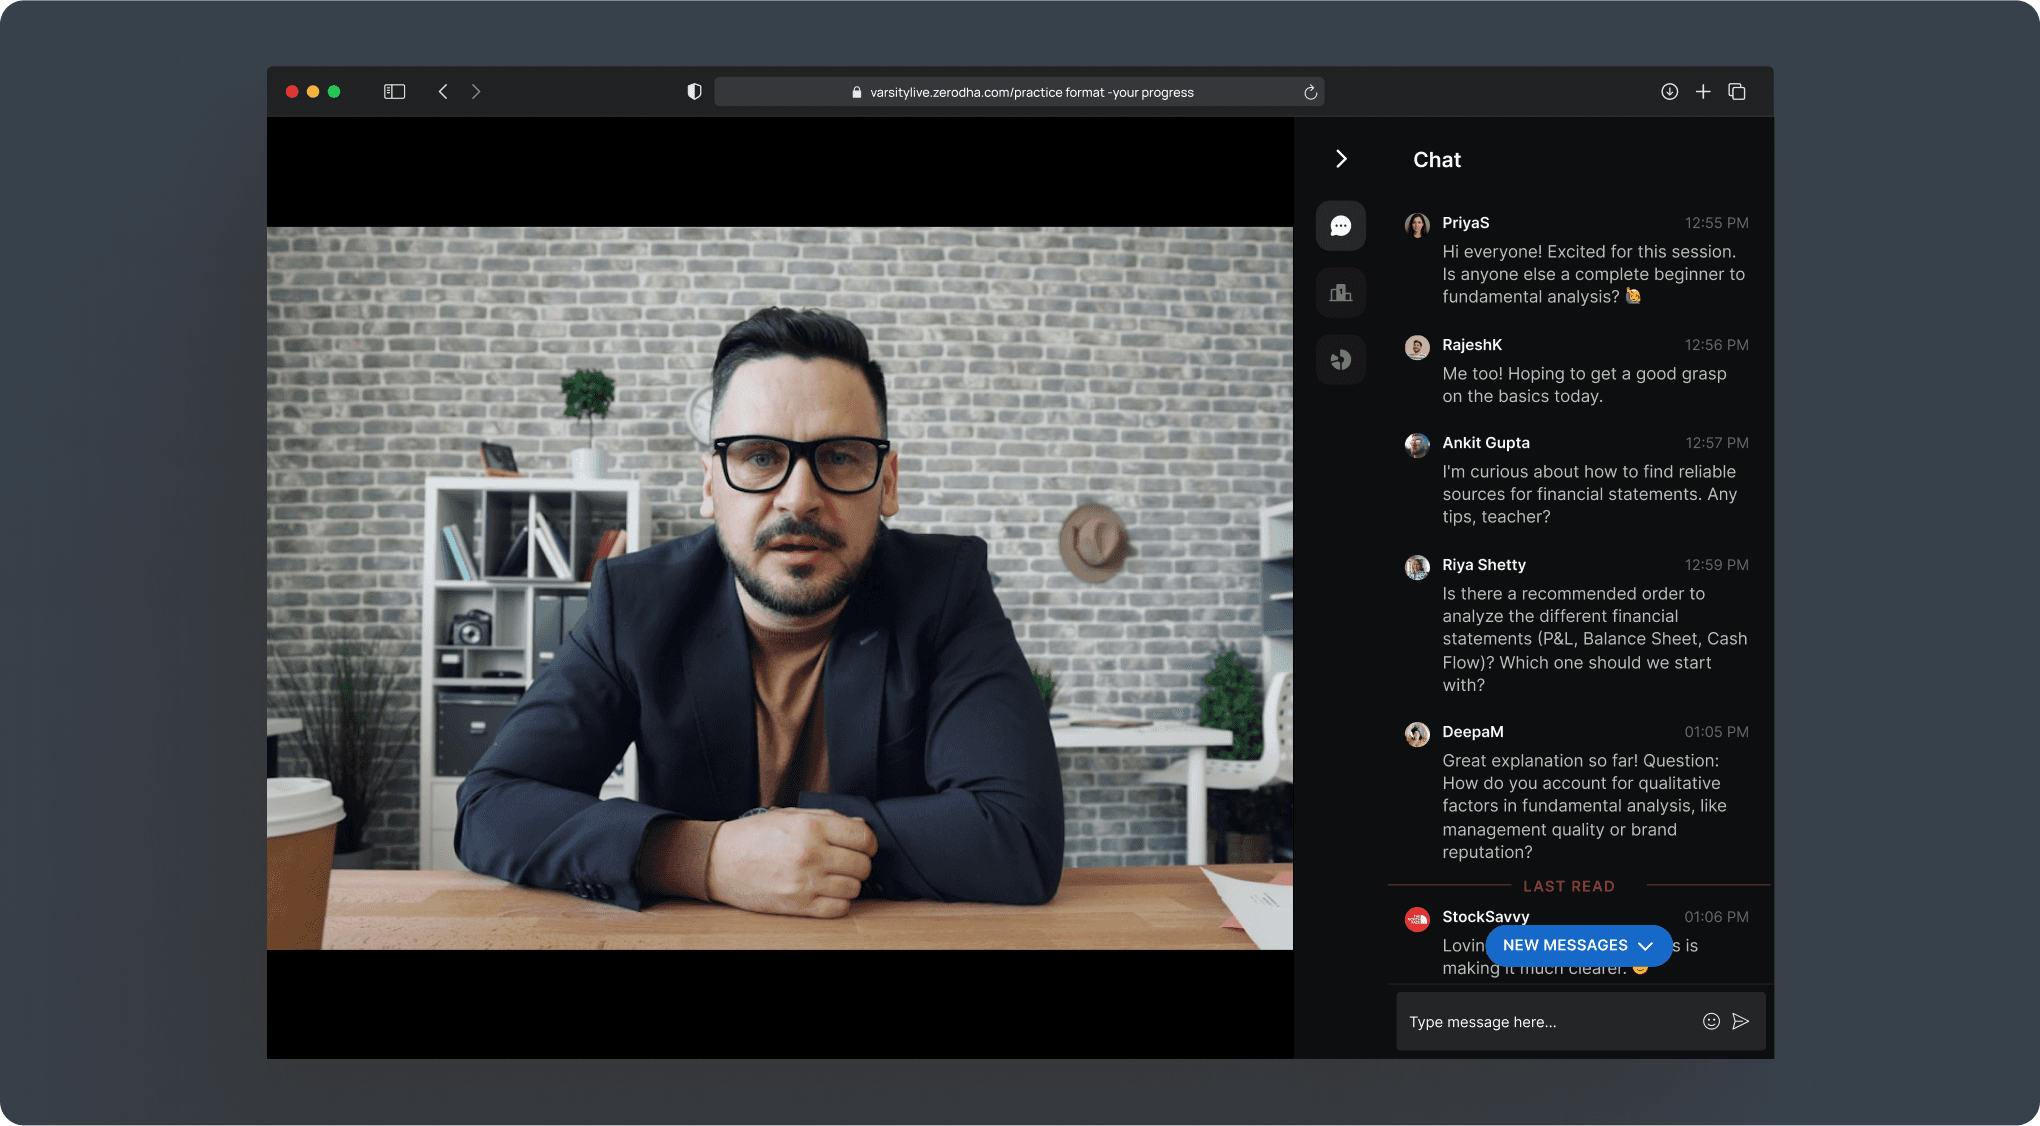
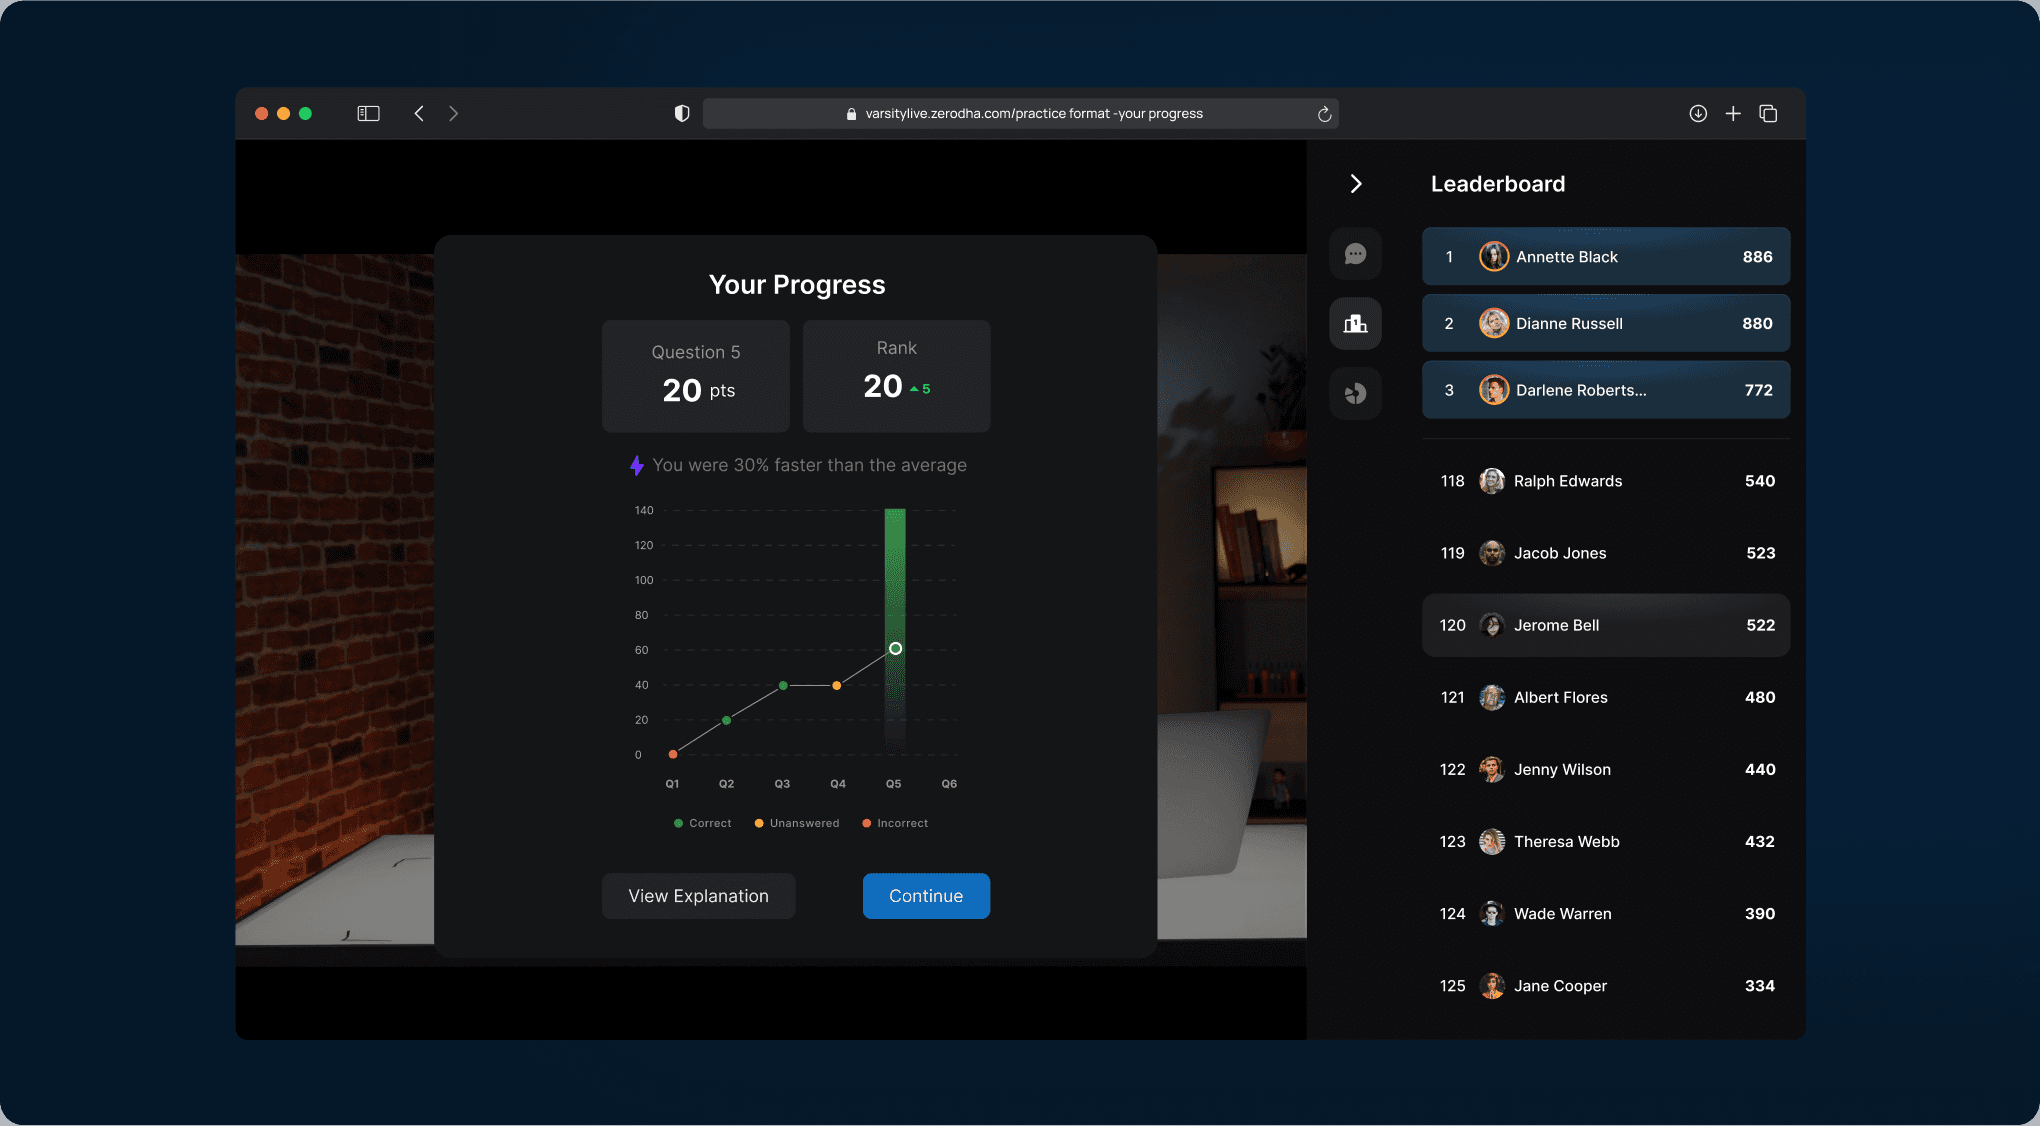
Overall 18% increase in User Engagement through Dashboard
Boosted user engagement through increase in average time spent on the platform with insightful statistics. Dashboard provided a seamless learning experience by displaying minutes learned and leaderboard points using intuitive, visually appealing graphs.

Redesign of Homepage that show Practice Features - Leading to increase 22% in landing to registration ratio
To better communicate the platform's core value homepage features a dynamic video that gives you a direct glimpse into the Varsity Live session (practice-based learning) showing the interactive practice based learning, Live instant mentor feedback and community learning.
Program details page - Improved UX in program registration flow
Empower users to select their preferred language, date, and time with ease. Replacing the dropdown with radio buttons makes options visible front and center, simplifying cohort registration. Eliminating the pre-selected session bias for many.

Track user progress seamlessly with a session indicator, monitoring up to 15 sessions per user.

Optimized for mobile first, as over 76% of users access Varsity through their mobile devices.

Overall 18% increase in User Engagement through Dashboard
Boosted user engagement through increase in average time spent on the platform with insightful statistics. Dashboard provided a seamless learning experience by displaying minutes learned and leaderboard points using intuitive, visually appealing graphs.